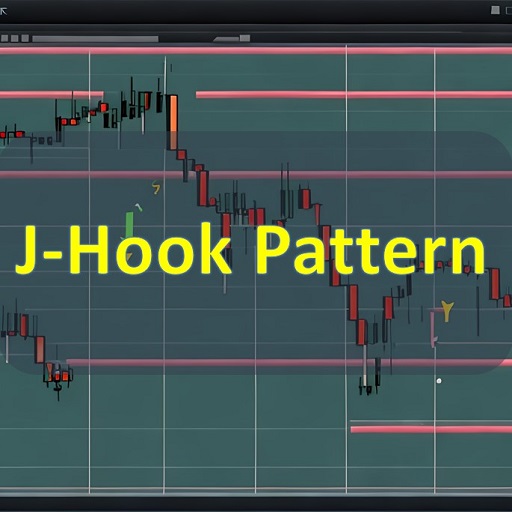
Hook pattern – financial markets have always attracted the attention of many people and investors. Analytical and strategic skills are of particular importance to gain profit in these markets. One of the important patterns in financial market analysis is the hook pattern. In this article, we examine and explain the hook pattern and its applications in financial markets.
What is a hook pattern?
J-Hook Pattern in financial markets refers to a chart pattern in the form of a hook or loop similar to the J structure . This pattern is used in a wide range of analytical tools and is usually recognized as an important indicator of a change in market direction.
Characteristics of the crochet pattern
– Hook pattern: The hook pattern usually has a curved and arched shape that includes a change in direction in the market movement.
– Influential: The hook pattern is commonly known as an influential signal in the market and may indicate a change in price direction or market trend.
– Probability of occurrence: this pattern can be recognized in a wide range of markets and the probability of its occurrence is calculated statistically.
Applications of hook pattern in financial markets
There are several uses for the hook pattern in the financial markets. Below I mention some of the uses of this pattern:
1. J-Hook Pattern in price charts can indicate a change in the direction of price movement. If a hook pattern is formed in a bullish chart, it may indicate the end of an uptrend and the beginning of a downtrend, and conversely, if a hook pattern is formed in a bearish chart, it may indicate the end of a downtrend and the beginning of an uptrend.
2. The hook pattern can be used as a signal to enter or exit trading positions in the market. For example, if a hook pattern forms on a price chart and the price moves higher, it can provide a buy signal. Likewise, if a hook pattern forms on the chart and the price moves lower, it can provide a sell signal.
3. The hook.pattern can be used to determine support and resistance levels. When a hook pattern is formed near a support level, it may indicate a strengthening of the possibility of breaking this level and continuing the upward movement. Likewise, a hook pattern near a resistance level may indicate weakness and the possibility that the price will hit this level and start a downward trend.
Finally, as you know, the analysis of financial markets is complex and dependent on many factors. In any case, the hook pattern can be a useful tool for analyzing and predicting price movements in financial markets. To use this model effectively, it is recommended to make a decision by carefully studying and analyzing trends and other market indicators.
Confirmation of other analytical signals
The hook.pattern can also be used as a tool to verify other analytical signals. Below are some examples of other analytical signals being confirmed by the hook pattern:
Verification of support and resistance levels
When a support or resistance level is drawn by lines or known as a strong level, the hook pattern can be a confirmation of this level. If the hook pattern forms near the support level and the price moves up, it can be a confirmation of the strength and stability of this level. Likewise, the formation of a hook pattern near the resistance level and the price moving down can be a confirmation of the strength and stability of this level.
Confirmation of other technical signals
The hook pattern can also act as a confirmation for other technical signals. For example, if a buy signal is given based on the median line trend or medium-term data trend and the hook pattern forms near the support level, this pattern can be a confirmation of the buy signal.
Confirmation of other pattern signals
A hook.pattern may be able to confirm signals formed by other patterns. For example, if a reversal pattern such as a shoulder and head pattern is formed and a hook pattern is formed near the peak and the price moves down, this pattern can be a confirmation of the reversal pattern.
Finally, to effectively use the hook pattern as a confirmation of other signals, it is recommended to always make decisions by carefully studying and analyzing market trends and charts and using appropriate risk management strategies.
Determining entry and exit points
To determine the entry and exit points with the hook pattern, you can use the following methods:
log in
– When the hook pattern forms near a support level and the price moves higher, you can consider entering a buy position.
Also, if the hook.pattern forms near the uptrend line, you can consider entering a buy position.
Exit
– When the hook pattern forms near a resistance level and the price moves down, you can consider exiting the buy position.
Also, if the hook pattern forms near the downtrend line, you can consider exiting the buy position.
In any case, before making a final decision, it is recommended to consider other market indicators and indicators and take into account detailed analysis of trends, support and resistance levels, and other patterns. Also, using appropriate risk management methods and determining stop loss levels can help you manage trading positions.
An example of a crochet pattern
Let’s give an example of a hook pattern on a price chart:
Let’s say you check the stock price of ABC company on a daily chart. You have identified an ascending hook pattern near a support level. The price chart has been bullish for the past few days and has reached a support level near $50. Then on the next day, the price rises significantly and reaches the $55 level. But then the price suddenly declines and moves lower, reaching $48 and then back up towards $54. Here, the hook pattern is formed.
This pattern indicates the strength of the support level near $50. With the formation of the hook pattern and the price returning to the support level, the probability of the continuation of the upward price trend in the future may increase. This pattern can be considered as a buy signal and you can check the buy position near the minimum price of the pattern. Also, other indicators and other technical analysis can be used to confirm the validity of this pattern.
How to recognize a hook pattern on a chart
You can use the following methods to recognize the hook pattern in the chart:
View price numbers
The hook pattern consists of an upward and then downward price movement. Therefore, checking the price numbers on the chart can help. You should first see an upward movement in price and then a return to the previous low or below. This return forms an inverted hook shape.
View price fluctuations
Examining the price fluctuations and the slope of the chart can be useful in detecting the hook pattern. A hook pattern is forming when the price rises significantly and then suddenly falls.
Use of technical indicators
Using technical indicators can help in identifying the hook pattern. For example, you can use indicators such as the MACD indicator , the RSI indicator , or other indicators to check for confirmation signals for the hook.pattern.
Use of analytical software
Financial market analysis software such as analytical charts are able to detect hook patterns. Using these software, you can analyze the price charts and identify the hook pattern.
Also, practice, study, and experience in analyzing price charts can improve your ability to spot the hook pattern. Undoubtedly, accurate recognition of different patterns and ability to recognize patterns improves with experience and practice.
Conclusion
In this article, we examined the hook pattern in financial markets. The hook pattern is recognized as an important pattern in market analysis and helps to detect changes in market direction, confirm other analytical signals, and determine entry and exit points. Using this pattern, investors can implement more successful strategies in the financial markets.
common questions
1. In what markets can the hook pattern be used?
The hook.pattern can be used in the analysis of various financial markets such as stock market, foreign exchange market, capital market, and non-decomposable commodity market.
2. Does the hook pattern always indicate a change in market direction?
No, the hook.pattern is only an indicator and should be combined with other analytical tools and indicators to make more optimal market entry and exit decisions.
3. Can the hook pattern also occur in reverse?
Yes, the hook pattern can also occur in reverse. In other words, it can indicate that the market is changing direction from bullish to bearish.
4. Is the hook pattern applicable to all timeframes?
Yes, the hook pattern can be recognized in all time frames such as minute, hourly, daily, weekly and monthly. But it should be noted that pattern verification is more important in larger timeframes.
5. Can the hook pattern be used in fundamental analysis?
The hook pattern is mostly used in technical analysis and identifying chart patterns. Fundamental analysis is about economic and financial factors and is usually not compatible with the hook pattern.


